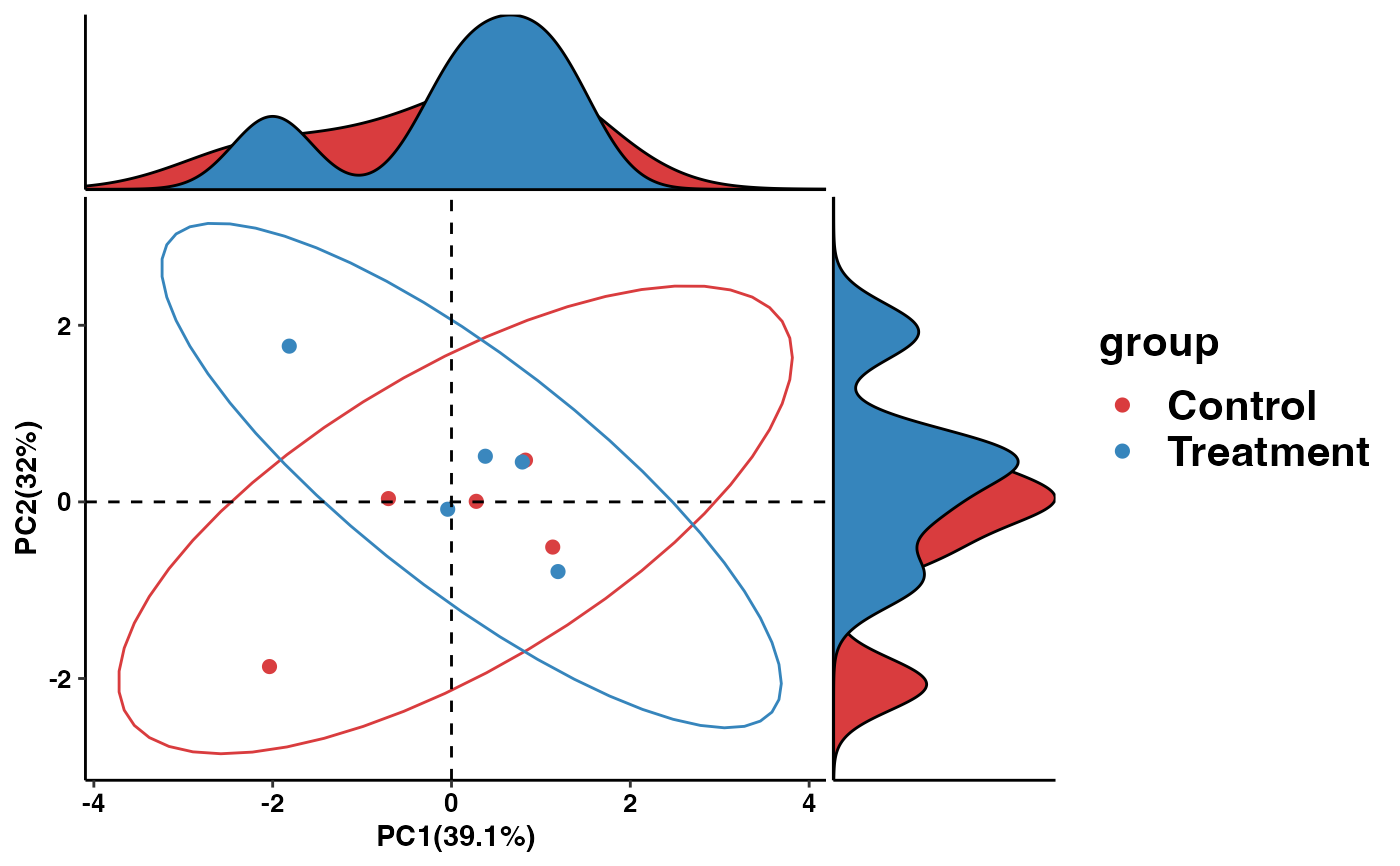
Perform Principal Component Analysis (PCA) on functional pathway abundance data and create visualizations of the PCA results.
Source:R/pathway_pca.R
pathway_pca.RdPerform Principal Component Analysis (PCA) on functional pathway abundance data and create visualizations of the PCA results.
Arguments
- abundance
A data frame, predicted functional pathway abundance.
- metadata
A tibble, consisting of sample information.
- group
A character, group name.
Examples
# Create example functional pathway abundance data
abundance_example <- data.frame(A = rnorm(10), B = rnorm(10), C = rnorm(10))

# Create example metadata
metadata_example <- tibble::tibble(sample_id = 1:10,
                                   group = factor(rep(c("Control", "Treatment"), each = 5)))

# Perform PCA and create visualizations
pca_plot <- pathway_pca(t(abundance_example), metadata_example, "group")
print(pca_plot)