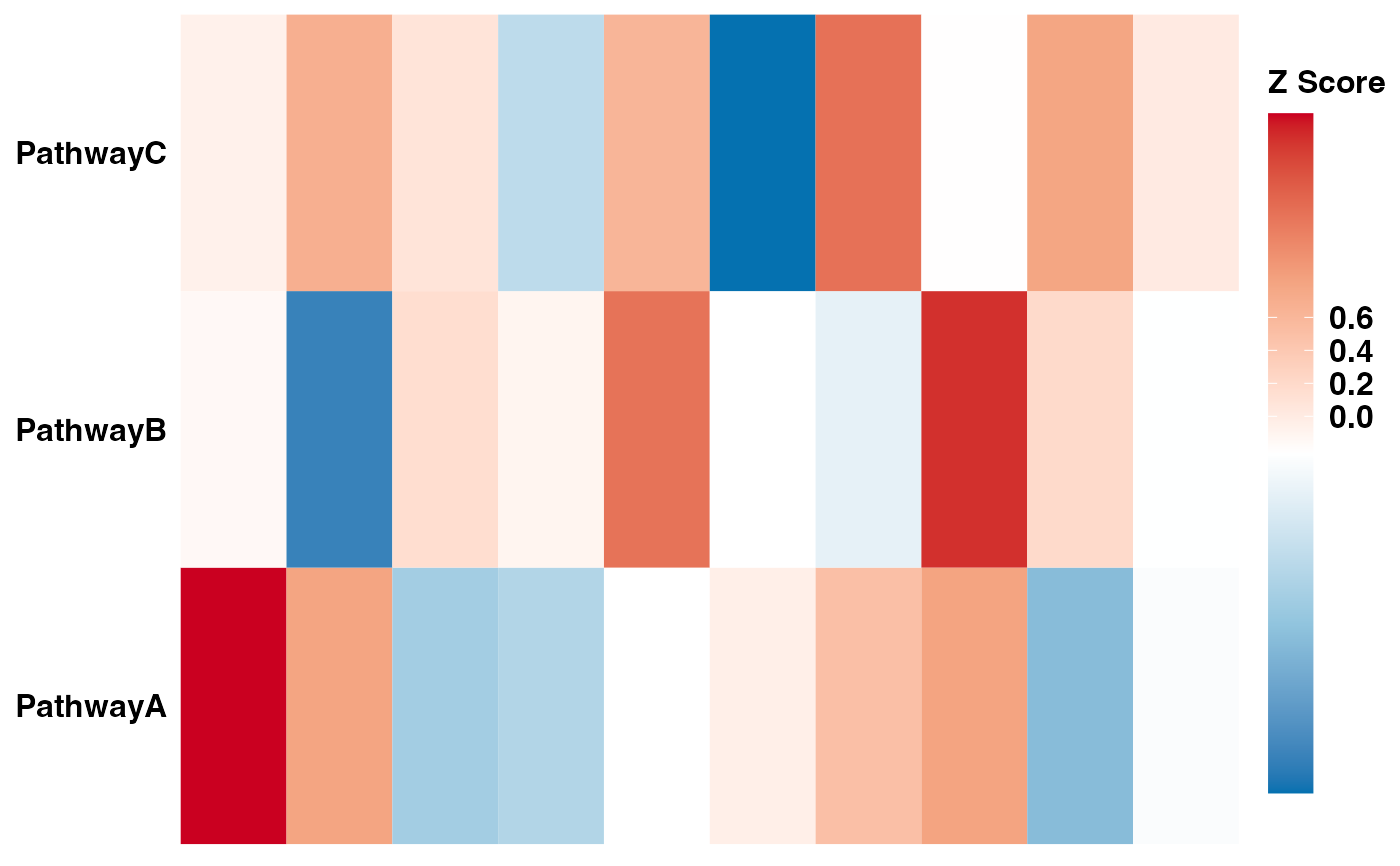
This function creates a heatmap of the predicted functional pathway abundance data. The function first makes the abundance data relative, then converts the abundance data to a long format and orders the samples based on the environment information. The heatmap is then created using the `ggplot2` library. The color palette, appearance and the color bar of the heatmap can be customized using the `scale_fill_gradientn`, `theme` and `guides` functions respectively.
Arguments
- abundance
A matrix or data frame of pathway abundance data, where columns correspond to samples and rows correspond to pathways.
- metadata
A data frame of metadata, where each row corresponds to a sample and each column corresponds to a metadata variable.
- group
A character string specifying the column name in the metadata data frame that contains the group variable.
Value
A ggplot heatmap object. The output is a ggplot object representing the heatmap of the predicted functional pathway abundance data. The heatmap visualizes the z score of pathways in different samples.
Examples
# Create example functional pathway abundance data
abundance_example <- matrix(rnorm(30), nrow = 10, ncol = 3)
rownames(abundance_example) <- paste0("Sample", 1:10)
colnames(abundance_example) <- c("PathwayA", "PathwayB", "PathwayC")

# Create example metadata
# Please ensure the sample IDs in the metadata have the column name "sample_name"
metadata_example <- data.frame(sample_name = rownames(abundance_example),
                               group = factor(rep(c("Control", "Treatment"), each = 5)))

# Create a heatmap
heatmap_plot <- pathway_heatmap(t(abundance_example), metadata_example, "group")
print(heatmap_plot)